StarRocks basics
This tutorial covers:
- Running StarRocks in a single Docker container
- Loading two public datasets including basic transformation of the data
- Analyzing the data with SELECT and JOIN
- Basic data transformation (the T in ETL)
The data used is provided by NYC OpenData and the National Centers for Environmental Information.
Both of these datasets are very large, and because this tutorial is intended to help you get exposed to working with StarRocks we are not going to load data for the past 120 years. You can run the Docker image and load this data on a machine with 4 GB RAM assigned to Docker. For larger fault-tolerant and scalable deployments we have other documentation and will provide that later.
There is a lot of information in this document, and it is presented with the step by step content at the beginning, and the technical details at the end. This is done to serve these purposes in this order:
- Allow the reader to load data in StarRocks and analyze that data.
- Explain the basics of data transformation during loading.
Prerequisites
Docker
- Docker
- 4 GB RAM assigned to Docker
- 10 GB free disk space assigned to Docker
SQL client
You can use the SQL client provided in the Docker environment, or use one on your system. Many MySQL compatible clients will work, and this guide covers the configuration of DBeaver and MySQL WorkBench.
curl
curl is used to issue the data load job to StarRocks, and to download the datasets. Check to see if you have it installed by running curl or curl.exe at your OS prompt. If curl is not installed, get curl here.
Terminology
FE
Frontend nodes are responsible for metadata management, client connection management, query planning, and query scheduling. Each FE stores and maintains a complete copy of metadata in its memory, which guarantees indiscriminate services among the FEs.
BE
Backend nodes are responsible for both data storage and executing query plans.
Launch StarRocks
docker run -p 9030:9030 -p 8030:8030 -p 8040:8040 -itd \
--name quickstart starrocks/allin1-ubuntu
SQL clients
These three clients are tested with this tutorial, you only need one:
- mysql CLI: You can run this from the Docker environment or your machine.
- DBeaver is available as a community version and a Pro version.
- MySQL Workbench
Configuring the client
- mysql CLI
- DBeaver
- MySQL Workbench
The easiest way to use the mysql CLI is to run it from the StarRocks container starrocks-fe:
docker exec -it quickstart \
mysql -P 9030 -h 127.0.0.1 -u root --prompt="StarRocks > "
If you would like to install the mysql CLI expand mysql client install below:
mysql client install
- macOS: If you use Homebrew and do not need MySQL Server run
brew install mysqlto install the CLI. - Linux: Check your repository system for the
mysqlclient. For example,yum install mariadb. - Microsoft Windows: Install the MySQL Community Server and run the provided client, or run
mysqlfrom WSL.
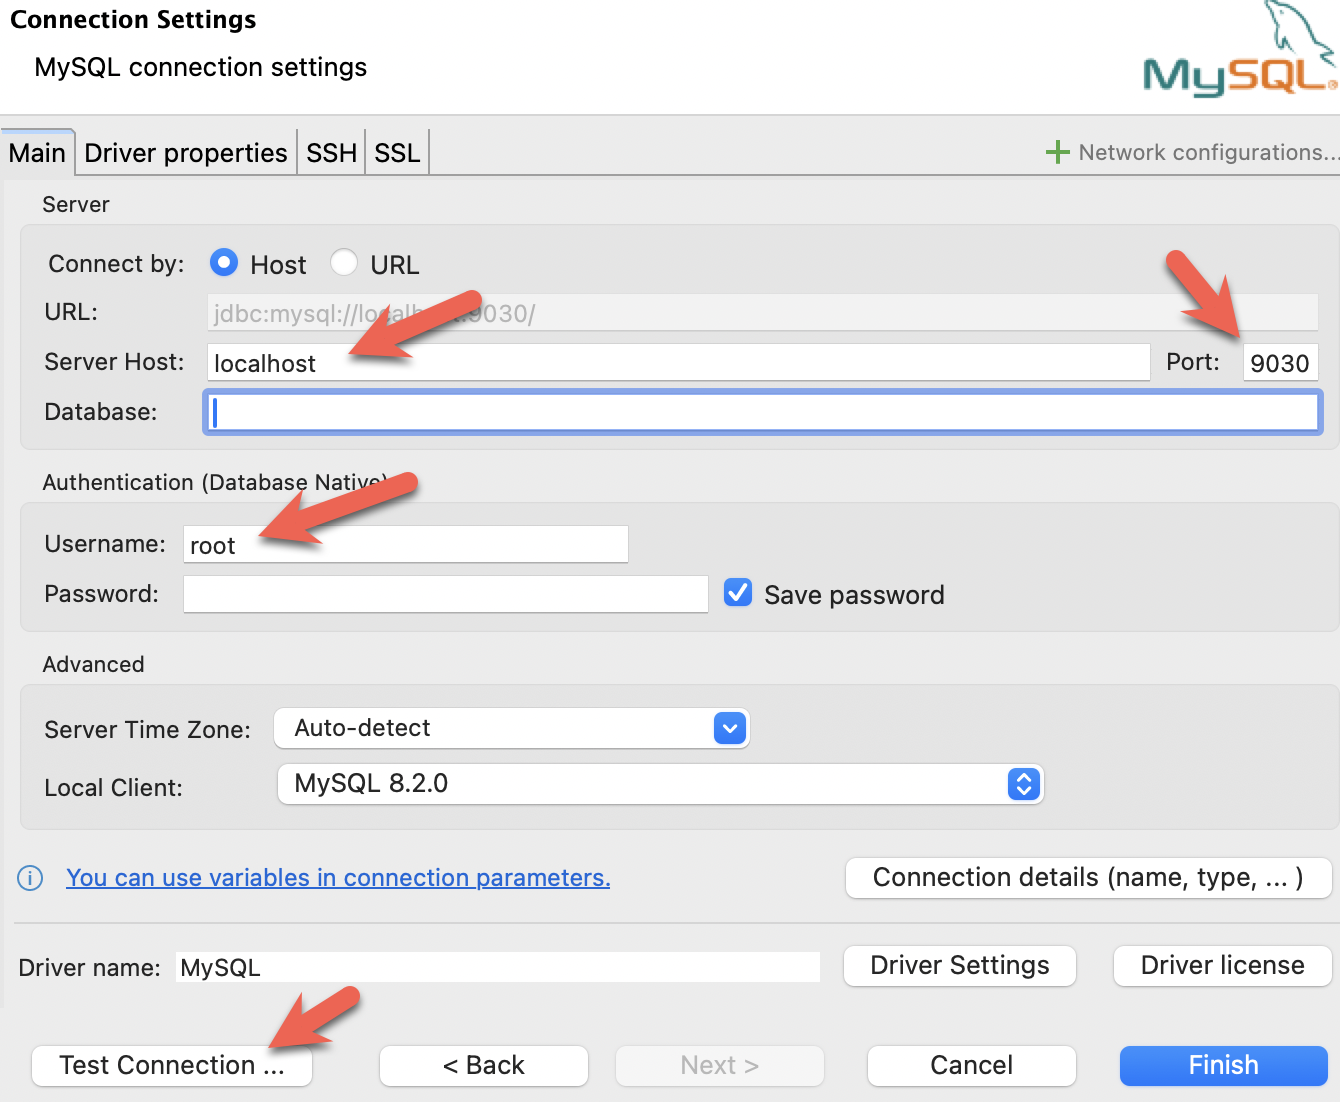
- Install DBeaver, and add a connection:
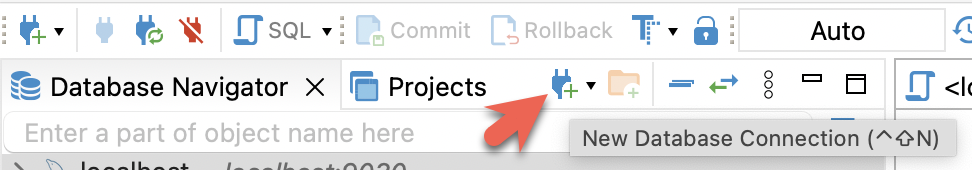
- Configure the port, IP, and username. Test the connection, and click Finish if the test succeeds:
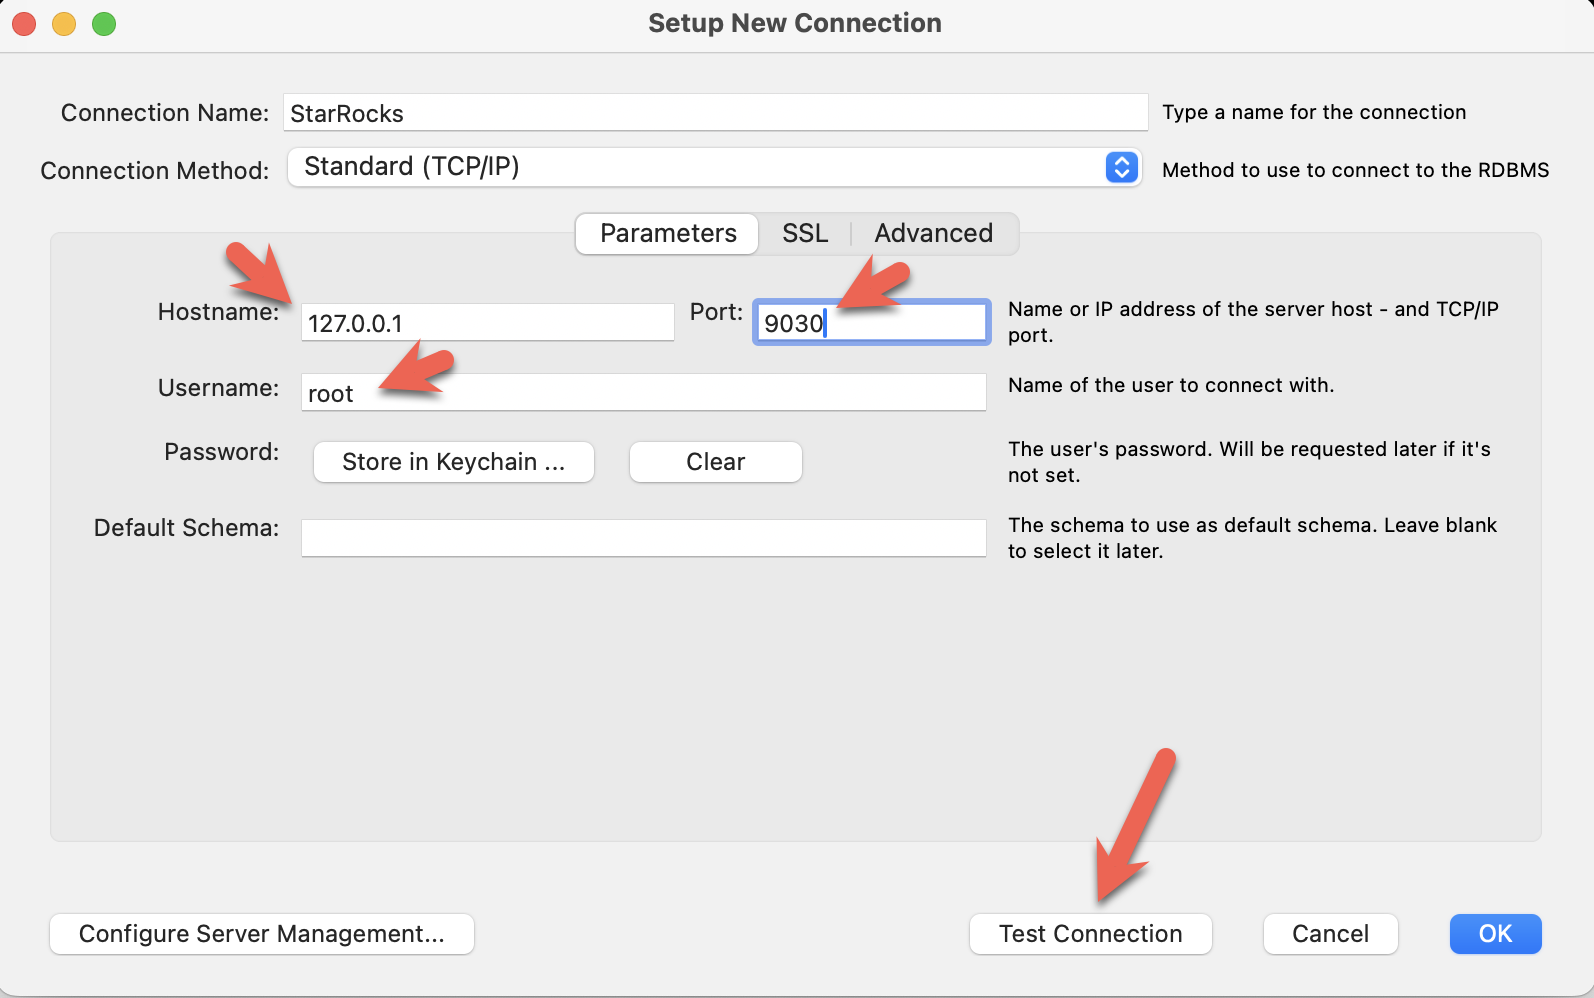
- Install the MySQL Workbench, and add a connection.
- Configure the port, IP, and username and then test the connection:
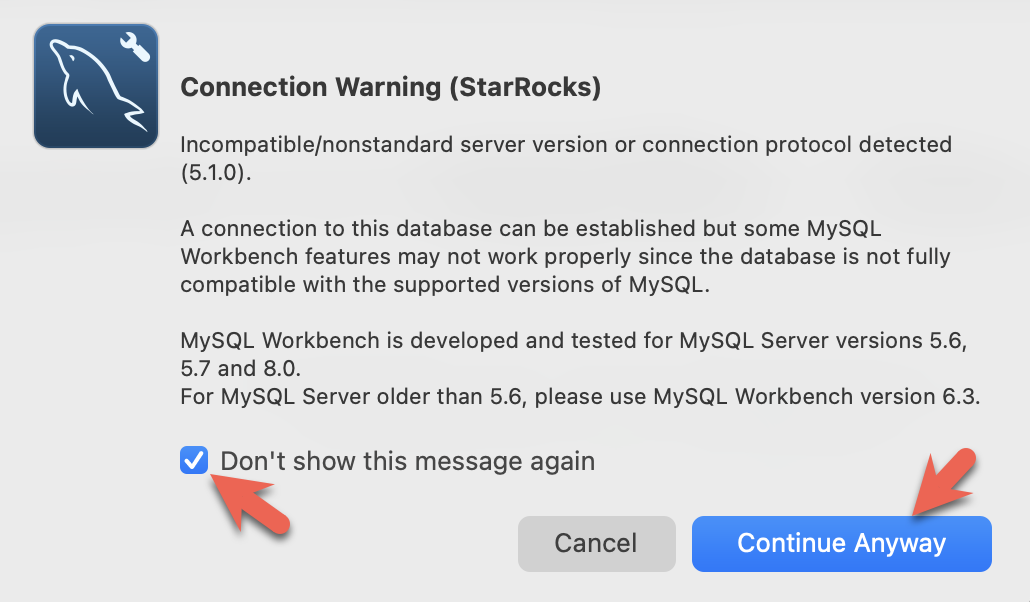
- You will see warnings from the Workbench as it is checking for a specific MySQL version. You can ignore the warnings and when prompted, you can configure Workbench to stop displaying the warnings:
Download the data
Download these two datasets to your machine. You can download them to the host machine where you are running Docker, they do not need to be downloaded inside the container.
New York City crash data
curl -O https://raw.githubusercontent.com/StarRocks/demo/master/documentation-samples/quickstart/datasets/NYPD_Crash_Data.csv
Weather data
curl -O https://raw.githubusercontent.com/StarRocks/demo/master/documentation-samples/quickstart/datasets/72505394728.csv
Connect to StarRocks with a SQL client
If you are using a client other than the mysql CLI, open that now.
This command will run the mysql command in the Docker container:
docker exec -it quickstart \
mysql -P 9030 -h 127.0.0.1 -u root --prompt="StarRocks > "
Create some tables
Create a database
Type these two lines in at the StarRocks > prompt and press enter after each:
CREATE DATABASE IF NOT EXISTS quickstart;

USE quickstart;
Create two tables
Crashdata
The crash dataset contains many more fields than these, the schema has been trimmed down to include only the fields that might be useful to answer questions about the impact weather has on driving conditions.
CREATE TABLE IF NOT EXISTS crashdata (
    CRASH_DATE DATETIME,
    BOROUGH STRING,
    ZIP_CODE STRING,
    LATITUDE INT,
    LONGITUDE INT,
    LOCATION STRING,
    ON_STREET_NAME STRING,
    CROSS_STREET_NAME STRING,
    OFF_STREET_NAME STRING,
    CONTRIBUTING_FACTOR_VEHICLE_1 STRING,
    CONTRIBUTING_FACTOR_VEHICLE_2 STRING,
    COLLISION_ID INT,
    VEHICLE_TYPE_CODE_1 STRING,
    VEHICLE_TYPE_CODE_2 STRING
);
Weatherdata
Similar to the crash data, the weather dataset has many more columns (a total of 125 columns) and only the ones that are expected to answer the questions are included in the database.
CREATE TABLE IF NOT EXISTS weatherdata (
    DATE DATETIME,
    NAME STRING,
    HourlyDewPointTemperature STRING,
    HourlyDryBulbTemperature STRING,
    HourlyPrecipitation STRING,
    HourlyPresentWeatherType STRING,
    HourlyPressureChange STRING,
    HourlyPressureTendency STRING,
    HourlyRelativeHumidity STRING,
    HourlySkyConditions STRING,
    HourlyVisibility STRING,
    HourlyWetBulbTemperature STRING,
    HourlyWindDirection STRING,
    HourlyWindGustSpeed STRING,
    HourlyWindSpeed STRING
);
Load two datasets
There are many ways to load data into StarRocks. For this tutorial the simplest way is to use curl and StarRocks Stream Load.
Open a new shell as these curl commands are run at the operating system prompt, not in the mysql client. The commands refer to the datasets that you downloaded, so run them from the directory where you downloaded the files.
You will be prompted for a password. You probably have not assigned a password to the MySQL root user, so just hit enter.
The curl commands look complex, but they are explained in detail at the end of the tutorial. For now, we recommend running the commands and running some SQL to analyze the data, and then reading about the data loading details at the end.
New York City collision data - Crashes
curl --location-trusted -u root             \
    -T ./NYPD_Crash_Data.csv                \
    -H "label:crashdata-0"                  \
    -H "column_separator:,"                 \
    -H "skip_header:1"                      \
    -H "enclose:\""                         \
    -H "max_filter_ratio:1"                 \
    -H "columns:tmp_CRASH_DATE, tmp_CRASH_TIME, CRASH_DATE=str_to_date(concat_ws(' ', tmp_CRASH_DATE, tmp_CRASH_TIME), '%m/%d/%Y %H:%i'),BOROUGH,ZIP_CODE,LATITUDE,LONGITUDE,LOCATION,ON_STREET_NAME,CROSS_STREET_NAME,OFF_STREET_NAME,NUMBER_OF_PERSONS_INJURED,NUMBER_OF_PERSONS_KILLED,NUMBER_OF_PEDESTRIANS_INJURED,NUMBER_OF_PEDESTRIANS_KILLED,NUMBER_OF_CYCLIST_INJURED,NUMBER_OF_CYCLIST_KILLED,NUMBER_OF_MOTORIST_INJURED,NUMBER_OF_MOTORIST_KILLED,CONTRIBUTING_FACTOR_VEHICLE_1,CONTRIBUTING_FACTOR_VEHICLE_2,CONTRIBUTING_FACTOR_VEHICLE_3,CONTRIBUTING_FACTOR_VEHICLE_4,CONTRIBUTING_FACTOR_VEHICLE_5,COLLISION_ID,VEHICLE_TYPE_CODE_1,VEHICLE_TYPE_CODE_2,VEHICLE_TYPE_CODE_3,VEHICLE_TYPE_CODE_4,VEHICLE_TYPE_CODE_5" \
    -XPUT http://localhost:8030/api/quickstart/crashdata/_stream_load
Here is the output of the preceding command. The first highlighted section shows what you should expect to see (OK and all but one row inserted). One row was filtered out because it does not contain the correct number of columns.
Enter host password for user 'root':
{
    "TxnId": 2,
    "Label": "crashdata-0",
    "Status": "Success",
    "Message": "OK",
    "NumberTotalRows": 423726,
    "NumberLoadedRows": 423725,
    "NumberFilteredRows": 1,
    "NumberUnselectedRows": 0,
    "LoadBytes": 96227746,
    "LoadTimeMs": 1013,
    "BeginTxnTimeMs": 21,
    "StreamLoadPlanTimeMs": 63,
    "ReadDataTimeMs": 563,
    "WriteDataTimeMs": 870,
    "CommitAndPublishTimeMs": 57,
    "ErrorURL": "http://127.0.0.1:8040/api/_load_error_log?file=error_log_da41dd88276a7bfc_739087c94262ae9f"
}%
If there was an error the output provides a URL to see the error messages. Open this in a browser to find out what happened. Expand the detail to see the error message:
Reading error messages in the browser
Error: Value count does not match column count. Expect 29, but got 32.

Column delimiter: 44,Row delimiter: 10.. Row: 09/06/2015,14:15,,,40.6722269,-74.0110059,"(40.6722269, -74.0110059)",,,"R/O 1 BEARD ST. ( IKEA'S
09/14/2015,5:30,BRONX,10473,40.814551,-73.8490955,"(40.814551, -73.8490955)",TORRY AVENUE                    ,NORTON AVENUE                   ,,0,0,0,0,0,0,0,0,Driver Inattention/Distraction,Unspecified,,,,3297457,PASSENGER VEHICLE,PASSENGER VEHICLE,,,
Weather data
Load the weather dataset in the same manner as you loaded the crash data.
curl --location-trusted -u root             \
    -T ./72505394728.csv                    \
    -H "label:weather-0"                    \
    -H "column_separator:,"                 \
    -H "skip_header:1"                      \
    -H "enclose:\""                         \
    -H "max_filter_ratio:1"                 \
    -H "columns: STATION, DATE, LATITUDE, LONGITUDE, ELEVATION, NAME, REPORT_TYPE, SOURCE, HourlyAltimeterSetting, HourlyDewPointTemperature, HourlyDryBulbTemperature, HourlyPrecipitation, HourlyPresentWeatherType, HourlyPressureChange, HourlyPressureTendency, HourlyRelativeHumidity, HourlySkyConditions, HourlySeaLevelPressure, HourlyStationPressure, HourlyVisibility, HourlyWetBulbTemperature, HourlyWindDirection, HourlyWindGustSpeed, HourlyWindSpeed, Sunrise, Sunset, DailyAverageDewPointTemperature, DailyAverageDryBulbTemperature, DailyAverageRelativeHumidity, DailyAverageSeaLevelPressure, DailyAverageStationPressure, DailyAverageWetBulbTemperature, DailyAverageWindSpeed, DailyCoolingDegreeDays, DailyDepartureFromNormalAverageTemperature, DailyHeatingDegreeDays, DailyMaximumDryBulbTemperature, DailyMinimumDryBulbTemperature, DailyPeakWindDirection, DailyPeakWindSpeed, DailyPrecipitation, DailySnowDepth, DailySnowfall, DailySustainedWindDirection, DailySustainedWindSpeed, DailyWeather, MonthlyAverageRH, MonthlyDaysWithGT001Precip, MonthlyDaysWithGT010Precip, MonthlyDaysWithGT32Temp, MonthlyDaysWithGT90Temp, MonthlyDaysWithLT0Temp, MonthlyDaysWithLT32Temp, MonthlyDepartureFromNormalAverageTemperature, MonthlyDepartureFromNormalCoolingDegreeDays, MonthlyDepartureFromNormalHeatingDegreeDays, MonthlyDepartureFromNormalMaximumTemperature, MonthlyDepartureFromNormalMinimumTemperature, MonthlyDepartureFromNormalPrecipitation, MonthlyDewpointTemperature, MonthlyGreatestPrecip, MonthlyGreatestPrecipDate, MonthlyGreatestSnowDepth, MonthlyGreatestSnowDepthDate, MonthlyGreatestSnowfall, MonthlyGreatestSnowfallDate, MonthlyMaxSeaLevelPressureValue, MonthlyMaxSeaLevelPressureValueDate, MonthlyMaxSeaLevelPressureValueTime, MonthlyMaximumTemperature, MonthlyMeanTemperature, MonthlyMinSeaLevelPressureValue, MonthlyMinSeaLevelPressureValueDate, MonthlyMinSeaLevelPressureValueTime, MonthlyMinimumTemperature, MonthlySeaLevelPressure, MonthlyStationPressure, MonthlyTotalLiquidPrecipitation, MonthlyTotalSnowfall, MonthlyWetBulb, AWND, CDSD, CLDD, DSNW, HDSD, HTDD, NormalsCoolingDegreeDay, NormalsHeatingDegreeDay, ShortDurationEndDate005, ShortDurationEndDate010, ShortDurationEndDate015, ShortDurationEndDate020, ShortDurationEndDate030, ShortDurationEndDate045, ShortDurationEndDate060, ShortDurationEndDate080, ShortDurationEndDate100, ShortDurationEndDate120, ShortDurationEndDate150, ShortDurationEndDate180, ShortDurationPrecipitationValue005, ShortDurationPrecipitationValue010, ShortDurationPrecipitationValue015, ShortDurationPrecipitationValue020, ShortDurationPrecipitationValue030, ShortDurationPrecipitationValue045, ShortDurationPrecipitationValue060, ShortDurationPrecipitationValue080, ShortDurationPrecipitationValue100, ShortDurationPrecipitationValue120, ShortDurationPrecipitationValue150, ShortDurationPrecipitationValue180, REM, BackupDirection, BackupDistance, BackupDistanceUnit, BackupElements, BackupElevation, BackupEquipment, BackupLatitude, BackupLongitude, BackupName, WindEquipmentChangeDate" \
    -XPUT http://localhost:8030/api/quickstart/weatherdata/_stream_load
Answer some questions
These queries can be run in your SQL client.
How many crashes are there per hour in NYC?
SELECT COUNT(*),
       date_trunc("hour", crashdata.CRASH_DATE) AS Time
FROM crashdata
GROUP BY Time
ORDER BY Time ASC
LIMIT 200;
Here is part of the output. Note that I am looking closer at January 6th and 7th as this is Monday and Tuesday of a non-holiday week. Looking at New Years Day is probably not indicative of a normal morning during rush-hour traffic.
|       14 | 2014-01-06 06:00:00 |
|       16 | 2014-01-06 07:00:00 |
|       43 | 2014-01-06 08:00:00 |
|       44 | 2014-01-06 09:00:00 |
|       21 | 2014-01-06 10:00:00 |
|       28 | 2014-01-06 11:00:00 |
|       34 | 2014-01-06 12:00:00 |
|       31 | 2014-01-06 13:00:00 |
|       35 | 2014-01-06 14:00:00 |
|       36 | 2014-01-06 15:00:00 |
|       33 | 2014-01-06 16:00:00 |
|       40 | 2014-01-06 17:00:00 |
|       35 | 2014-01-06 18:00:00 |
|       23 | 2014-01-06 19:00:00 |
|       16 | 2014-01-06 20:00:00 |
|       12 | 2014-01-06 21:00:00 |
|       17 | 2014-01-06 22:00:00 |
|       14 | 2014-01-06 23:00:00 |
|       10 | 2014-01-07 00:00:00 |
|        4 | 2014-01-07 01:00:00 |
|        1 | 2014-01-07 02:00:00 |
|        3 | 2014-01-07 03:00:00 |
|        2 | 2014-01-07 04:00:00 |
|        6 | 2014-01-07 06:00:00 |
|       16 | 2014-01-07 07:00:00 |
|       41 | 2014-01-07 08:00:00 |
|       37 | 2014-01-07 09:00:00 |
|       33 | 2014-01-07 10:00:00 |
It looks like about 40 accidents on a Monday or Tuesday morning during rush hour traffic, and around the same at 17:00 hours.
What is the average temperature in NYC?
SELECT avg(HourlyDryBulbTemperature),
       date_trunc("hour", weatherdata.DATE) AS Time
FROM weatherdata
GROUP BY Time
ORDER BY Time ASC
LIMIT 100;
Output:
Note that this is data from 2014, NYC has not been this cold lately.
+-------------------------------+---------------------+
| avg(HourlyDryBulbTemperature) | Time                |
+-------------------------------+---------------------+
|                            25 | 2014-01-01 00:00:00 |
|                            25 | 2014-01-01 01:00:00 |
|                            24 | 2014-01-01 02:00:00 |
|                            24 | 2014-01-01 03:00:00 |
|                            24 | 2014-01-01 04:00:00 |
|                            24 | 2014-01-01 05:00:00 |
|                            25 | 2014-01-01 06:00:00 |
|                            26 | 2014-01-01 07:00:00 |
Is it safe to drive in NYC when visibility is poor?
Let's look at the number of crashes when visibility is poor (between 0 and 1.0 miles). To answer this question use a JOIN across the two tables on the DATETIME column.
SELECT COUNT(DISTINCT c.COLLISION_ID) AS Crashes,
       truncate(avg(w.HourlyDryBulbTemperature), 1) AS Temp_F,
       truncate(avg(w.HourlyVisibility), 2) AS Visibility,
       max(w.HourlyPrecipitation) AS Precipitation,
       date_format((date_trunc("hour", c.CRASH_DATE)), '%d %b %Y %H:%i') AS Hour
FROM crashdata c
LEFT JOIN weatherdata w
ON date_trunc("hour", c.CRASH_DATE)=date_trunc("hour", w.DATE)
WHERE w.HourlyVisibility BETWEEN 0.0 AND 1.0
GROUP BY Hour
ORDER BY Crashes DESC
LIMIT 100;
The highest number of crashes in a single hour during low visibility is 129. There are multiple things to consider:
- February 3rd 2014 was a Monday
- 8AM is rush hour
- It was raining (0.12 inches or precipitation that hour)
- The temperature is 32 degrees F (the freezing point for water)
- Visibility is bad at 0.25 miles, normal for NYC is 10 miles
+---------+--------+------------+---------------+-------------------+
| Crashes | Temp_F | Visibility | Precipitation | Hour              |
+---------+--------+------------+---------------+-------------------+
|     129 |     32 |       0.25 | 0.12          | 03 Feb 2014 08:00 |
|     114 |     32 |       0.25 | 0.12          | 03 Feb 2014 09:00 |
|     104 |     23 |       0.33 | 0.03          | 09 Jan 2015 08:00 |
|      96 |   26.3 |       0.33 | 0.07          | 01 Mar 2015 14:00 |
|      95 |     26 |       0.37 | 0.12          | 01 Mar 2015 15:00 |
|      93 |     35 |       0.75 | 0.09          | 18 Jan 2015 09:00 |
|      92 |     31 |       0.25 | 0.12          | 03 Feb 2014 10:00 |
|      87 |   26.8 |        0.5 | 0.09          | 01 Mar 2015 16:00 |
|      85 |     55 |       0.75 | 0.20          | 23 Dec 2015 17:00 |
|      85 |     20 |       0.62 | 0.01          | 06 Jan 2015 11:00 |
|      83 |   19.6 |       0.41 | 0.04          | 05 Mar 2015 13:00 |
|      80 |     20 |       0.37 | 0.02          | 06 Jan 2015 10:00 |
|      76 |   26.5 |       0.25 | 0.06          | 05 Mar 2015 09:00 |
|      71 |     26 |       0.25 | 0.09          | 05 Mar 2015 10:00 |
|      71 |   24.2 |       0.25 | 0.04          | 05 Mar 2015 11:00 |
What about driving in icy conditions?
Water vapor can desublimate to ice at 40 degrees F; this query looks at temps between 0 and 40 degrees F.
SELECT COUNT(DISTINCT c.COLLISION_ID) AS Crashes,
       truncate(avg(w.HourlyDryBulbTemperature), 1) AS Temp_F,
       truncate(avg(w.HourlyVisibility), 2) AS Visibility,
       max(w.HourlyPrecipitation) AS Precipitation,
       date_format((date_trunc("hour", c.CRASH_DATE)), '%d %b %Y %H:%i') AS Hour
FROM crashdata c
LEFT JOIN weatherdata w
ON date_trunc("hour", c.CRASH_DATE)=date_trunc("hour", w.DATE)
WHERE w.HourlyDryBulbTemperature BETWEEN 0.0 AND 40.5
GROUP BY Hour
ORDER BY Crashes DESC
LIMIT 100;
The results for freezing temperatures suprised me a little, I did not expect too much traffic on a Sunday morning in the city on a cold January day.A quick look at weather.com showed that there was a big storm with many crashes that day, just like what can be seen in the data.
+---------+--------+------------+---------------+-------------------+
| Crashes | Temp_F | Visibility | Precipitation | Hour              |
+---------+--------+------------+---------------+-------------------+
|     192 |     34 |        1.5 | 0.09          | 18 Jan 2015 08:00 |
|     170 |     21 |       NULL |               | 21 Jan 2014 10:00 |
|     145 |     19 |       NULL |               | 21 Jan 2014 11:00 |
|     138 |   33.5 |          5 | 0.02          | 18 Jan 2015 07:00 |
|     137 |     21 |       NULL |               | 21 Jan 2014 09:00 |
|     129 |     32 |       0.25 | 0.12          | 03 Feb 2014 08:00 |
|     114 |     32 |       0.25 | 0.12          | 03 Feb 2014 09:00 |
|     104 |     23 |        0.7 | 0.04          | 09 Jan 2015 08:00 |
|      98 |     16 |          8 | 0.00          | 06 Mar 2015 08:00 |
|      96 |   26.3 |       0.33 | 0.07          | 01 Mar 2015 14:00 |
Drive carefully!
Summary
In this tutorial you:
- Deployed StarRocks in Docker
- Loaded crash data provided by New York City and weather data provided by NOAA
- Analyzed the data using SQL JOINs to find out that driving in low visibility or icy streets is a bad idea
There is more to learn; we intentionally glossed over the data transformation done during the Stream Load. The details on that are in the notes on the curl commands below.
Notes on the curl commands
StarRocks Stream Load and curl take many arguments. Only the ones used in this tutorial are described here, the rest will be linked to in the more information section.
--location-trusted
This configures curl to pass credentials to any redirected URLs.
-u root
The username used to log in to StarRocks
-T filename
T is for transfer, the filename to transfer.
label:name-num
The label to associate with this Stream Load job. The label must be unique, so if you run the job multiple times you can add a number and keep incrementing that.
column_separator:,
If you load a file that uses a single , then set it as shown above, if you use a different delimiter then set that delimiter here. Common choices are \t, ,, and |.
skip_header:1
Some CSV files have a single header row with all of the column names listed, and some add a second line with datatypes. Set skip_header to 1 or 2 if you have one or two header lines, and set it to 0 if you have none.
enclose:\"
It is common to enclose strings that contain embedded commas with double-quotes. The sample datasets used in this tutorial have geo locations that contain commas and so the enclose setting is set to \". Remember to escape the " with a \.
max_filter_ratio:1
This allows some errors in the data. Ideally this would be set to 0 and the job would fail with any errors. It is set to 1 to allow all rows to fail during debugging.
columns:
The mapping of CSV file columns to StarRocks table columns. You will notice that there are many more columns in the CSV files than columns in the table. Any columns that are not included in the table are skipped.
You will also notice that there is some transformation of data included in the columns: line for the crash dataset. It is very common to find dates and times in CSV files that do not conform to standards. This is the logic for converting the CSV data for the time and date of the crash to a DATETIME type:
The columns line
This is the beginning of one data record. The date is in MM/DD/YYYY format, and the time is HH:MI. Since DATETIME is generally YYYY-MM-DD HH:MI:SS we need to transform this data.
08/05/2014,9:10,BRONX,10469,40.8733019,-73.8536375,"(40.8733019, -73.8536375)",
This is the beginning of the columns: parameter:
-H "columns:tmp_CRASH_DATE, tmp_CRASH_TIME, CRASH_DATE=str_to_date(concat_ws(' ', tmp_CRASH_DATE, tmp_CRASH_TIME), '%m/%d/%Y %H:%i')
This instructs StarRocks to:
- Assign the content of the first column of the CSV file to
tmp_CRASH_DATE - Assign the content of the second column of the CSV file to
tmp_CRASH_TIME concat_ws()concatenatestmp_CRASH_DATEandtmp_CRASH_TIMEtogether with a space between themstr_to_date()creates a DATETIME from the concatenated string- store the resulting DATETIME in the column
CRASH_DATE
More information
The Motor Vehicle Collisions - Crashes dataset is provided by New York City subject to these terms of use and privacy policy.
The Local Climatological Data(LCD) is provided by NOAA with this disclaimer and this privacy policy.